Interactive Debugging Tools
Debugging your site made easy with detailed insights and improvement tips
Knowing what’s happening when a page loads is key to understanding and improving the performance of your website. Niteco Performance Insight allows you to break down your site’s loading process into its component parts and easily detect the elements that are impacting performance.
Performance History
Knowing how your site performs over time is a valuable tool for monitoring and maintaining an effective website. See how key metrics perform over time and enable/disable specific metrics to focus on the areas of highest value. Go even further by comparing specific points in time to see the changes that occurred between them.

In the performance history view, you can choose any point in time to see your site’s or page’s performance stats at that time in detail.
Browser Waterfall
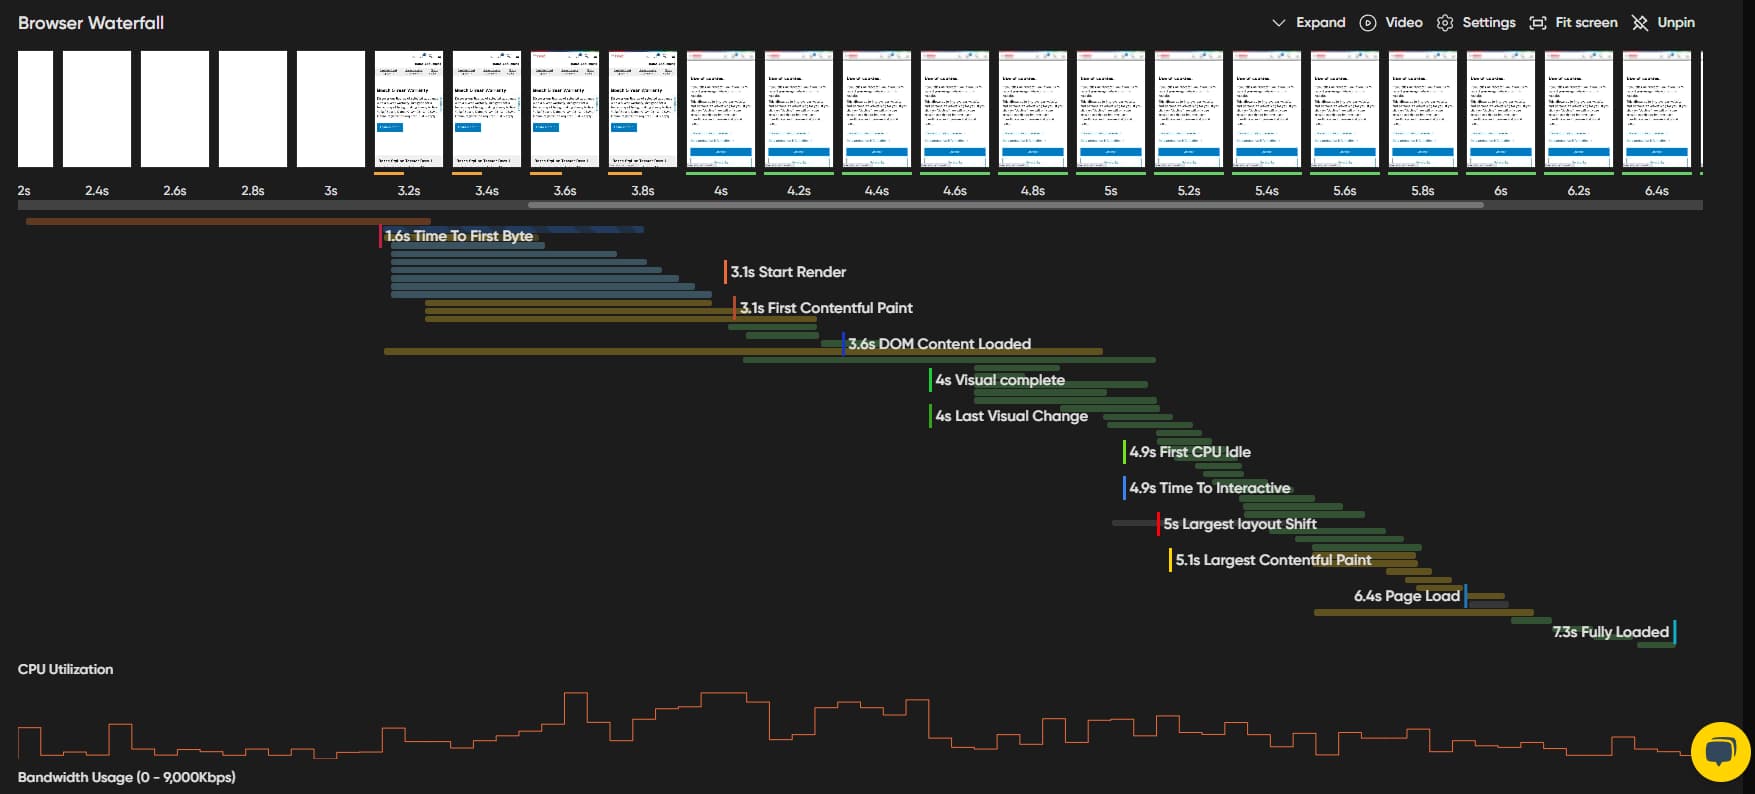
Review a detailed breakdown of the page loading process in the browser waterfall diagram:

In the browser waterfall view, you can take a closer look at all the elements that need to be loaded in order to show your page.
Using this view gives you a breakdown of the page loading sequence, accompanied by screenshots of what the browser is showing at each point. This enables you to drill into the loading sequence at any point in the page load lifecycle. Clicking on any part of the report shows an expanded view with the detail of the assets loaded and whether a script - video, font, or even third-party integration - is blocking execution, potentially causing rendering delays.
Cumulative Layout Shift
Improvement opportunities
As well as presenting details of your site, Niteco Performance Insight also provides suggested improvements that could be made to positively affect user experience.

Color-coded opportunities make it easy to tackle the bigger issues first.
For the page in question, the tool has suggested:
- Reducing unused CSS - only serve the style information you need to render the page.
- Reducing unused JavaScript - only serve the JavaScript needed to render the page.
- Eliminating render-blocking resources - refactor your code to remove render blocking.
- Using next-gen image formats and reducing image sizes - reduce the amount of data to be transferred.
These myriads of data and prompts at your fingertips enable your development team to take a deep dive into performance over time. This is an essential tool for diagnosing issues and optimizing performance.
Ready to gain deeper insights into your websites?
Start your monitoring journey today and enjoy 30-day access to essential website metrics.